Kilei Newme
With deep roots in hospitality cost analysis and inventory control, I build scalable systems that maximize financial performance and eliminate operational leakage. Using Power BI and Looker Studio, I transform raw data into dynamic, actionable insights—from precise consumption reviews to strategic menu engineering. I bring a methodical approach to every collaboration, ensuring your restaurant’s strategy is grounded in data and built for long-term profitability.


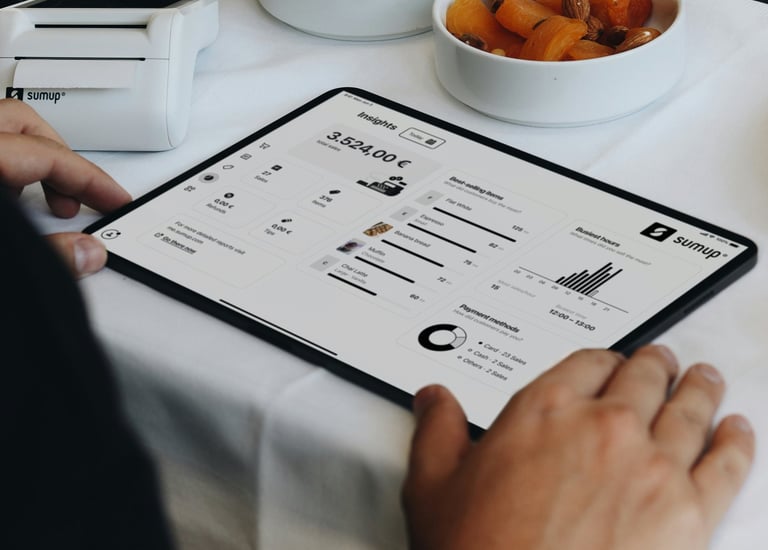
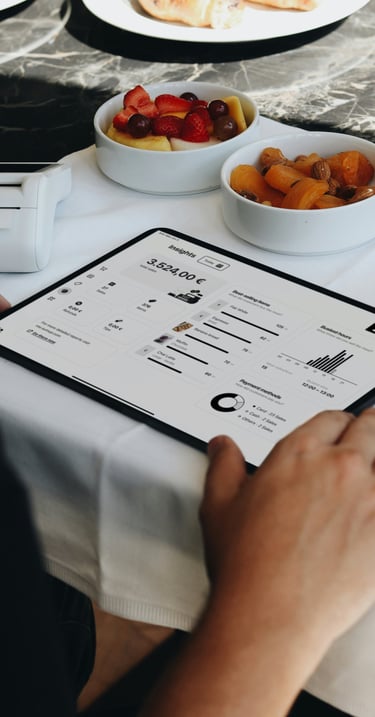
SALES REPORTS
Turn your POS data into a roadmap for growth. Visualize the sales trends so you can stop guessing and start scaling.
Peak Performance Tracking:
Display total sales figures by day, week, or shift to identify exactly when your staff needs to be at their best.
Profit-Driven Menu Engineering:
Don't just track what sells—reveal high-revenue items and laggards to optimize your menu for maximum margin.
Granular Filtering:
Deep-dive into data by outlet, promotional event, or individual server performance to identify top talent and training needs.
CONSUMPTION REPORTS
\Gain precise clarity on what drives your inventory cost and how to eliminate high-cost waste.
Demand Trend Forecasting
Highlight consumption patterns by outlet, time of day, and seasonality to accurately predict demand.
Inventory Control & Variance Tracking
Guide purchasing and stock rotation decisions.
Compare 'Predicted Consumption' based on sales against 'Actual Physical Inventory Used' to identify operational variance and theft.
Granular Audit Trail
Filter usage data by shift, promotional events, or specific server activity for a complete operational audit.


INVENTORY VARIANCE REPORTS
Identify discrepancies, eliminate inefficiencies, and secure your inventory against potential losses
Usage vs. Actual Reconciliation:
Instantly highlight discrepancies between recorded POS usage and physical stock counts to stop "invisible" losses.
Leakage Identification:
Isolate specific signs of pilferage, overproduction, or spillage by outlet and shift.
Trend Tracking:
Use trend lines to monitor frequently flagged items, turning recurring issues into fixed protocols.
Transparent Audit Trails:
Seamlessly link consumption logs with purchase records for a 100% transparent procurement chain.


COST & PROFITABILITY REPORTS
Identify margin opportunities and pricing strategies grounded in real-world performance data.
Margin Analysis:
Track gross profit, net margins, and food cost percentages by category to ensure every plate contributes to your bottom line.
Recipe vs. Revenue Audits:
Compare theoretical recipe costs against actual realized revenue to capture hidden margin opportunities.
Impact Simulation:
Model potential price or ingredient cost changes to evaluate their impact on total profitability before you commit.
Menu Optimization:
Identify high-cost, low-revenue "dogs" to guide strategic re-engineering and pricing decisions.


COMPARISON REPORTS
Benchmark performance to drive operational excellence.
Multi-Unit Analysis:
Compare Sales per Cover, Avg. Check Size, and Labor Cost % across locations to scale your "Gold Standard" workflows.
Target vs. Actual Variance:
Track real-time performance against budgets to identify exactly where your team is overperforming or falling short.
Department Benchmarking:
Audit Bar vs. Kitchen performance across shifts to optimize staffing and inventory allocation.
Vendor Pricing Audits:
Compare ingredient costs across suppliers to ensure you are securing the best market rates in Bangalore.


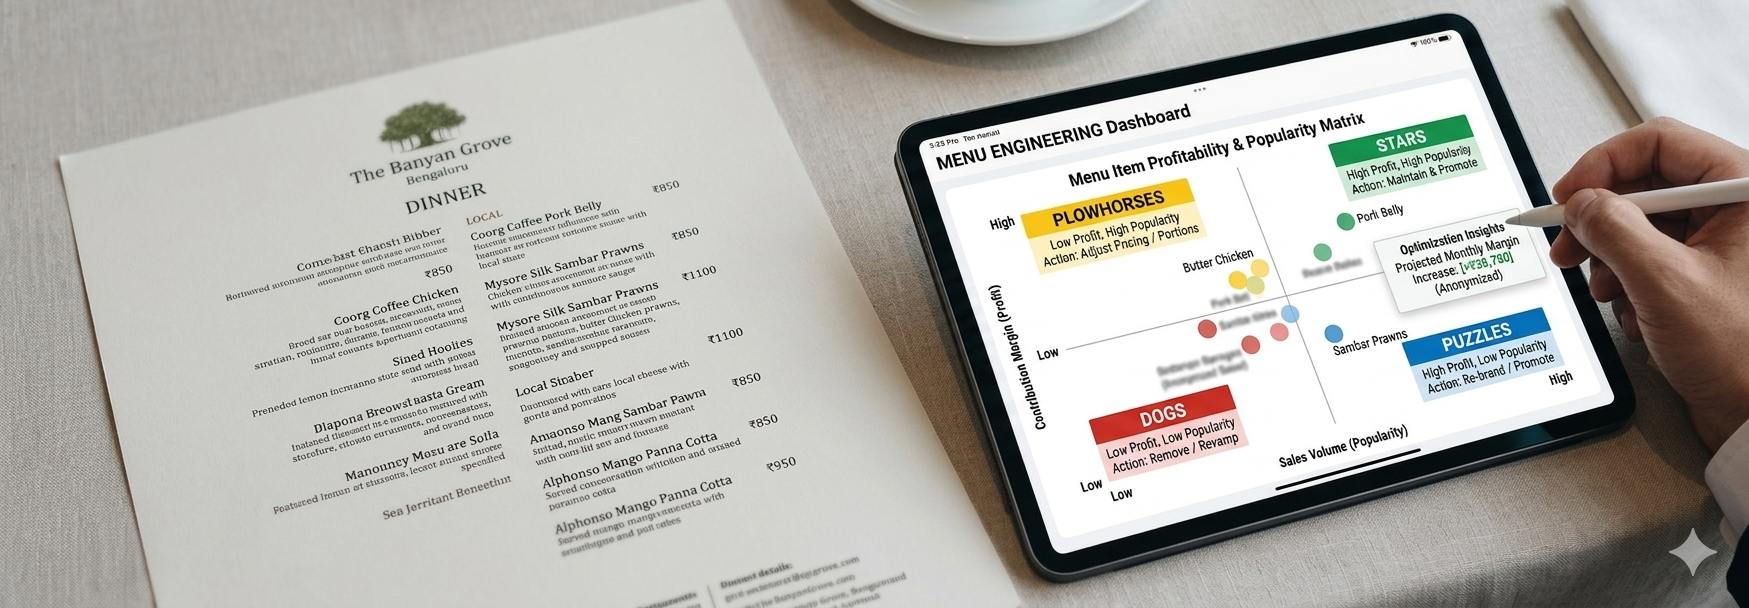
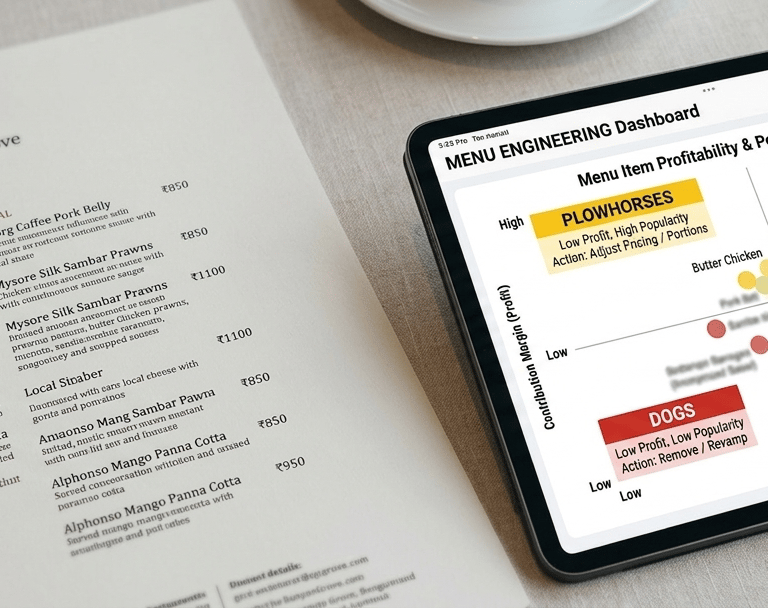
MENU ENGINEERING & DESIGN
Review vendor consistency, contract terms, and performance trends—so every decision is grounded in transparent data.
Profitability Matrix:
Categorize your menu into "Stars" (high profit, high popularity) and "Dogs" to guide strategic removals and price hikes.
Plate Costing Precision:
Analyze every ingredient down to the gram to ensure your actual margins match your targets.
Price Elasticity Modeling:
Use historical data to predict how customers will react to price changes before you print new menus.
Contribution Margin Optimization:
Focus on the cash left in your pocket, not just the food cost percentage.